The ageing wave: most and fewest aged 80 and over
The share of inhabitants aged 80 or over.
Bø has the highest share aged 80 and over of Norway's municipalities at 11.0% (2026). The lowest is Gjesdal at 2.8%. Source: SSB, table 07459, processed by Morning Analytics 2 November 2026.
Download the table (CSV) Sharing image (PNG)
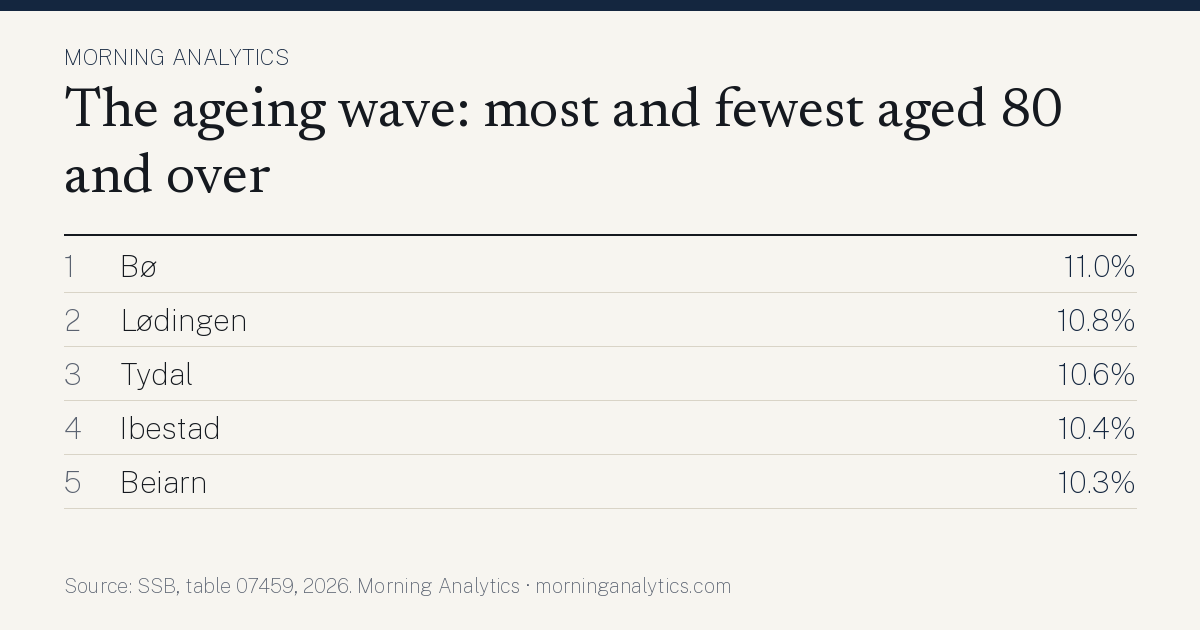
Analysis: why are some at the top and others at the bottom?
We compared share aged 80 and over with every other municipal figure we have, from Statistics Norway, NIPH and the Brønnøysund Register Centre. Below are the figures that go most closely together with share aged 80 and over across the country, and what marks the municipalities at the top and bottom on those figures.
The pattern across the country
- Municipalities that rank high on «Centrality (Statistics Norway's centrality index, 6 is most central)» most often rank low on share aged 80 and over (strong association, rank correlation −0.63 across 357 municipalities; Statistics Norway, centrality index).
- Municipalities that rank high on «Gross operating revenue per inhabitant» most often also rank high on share aged 80 and over (strong association, rank correlation 0.61 across 357 municipalities; Statistics Norway table 12137).
- Municipalities that rank high on «Population on 1 January» most often rank low on share aged 80 and over (strong association, rank correlation −0.59 across 357 municipalities; Statistics Norway table 11342).
- Municipalities that rank high on «Detached houses, share of all dwellings» most often also rank high on share aged 80 and over (strong association, rank correlation 0.59 across 357 municipalities; Statistics Norway table 06265).
The highest and the lowest
- No. 1 Bø (11.0%) Fits the pattern: «Detached houses, share of all dwellings» 83.6% (no. 69 of 357 from the top; Statistics Norway table 06265). Most distinctive industry: fiske, fangst og akvakultur, 11% of the jobs, 13.8 times the national share (Statistics Norway table 13470, 2025).
- No. 2 Lødingen (10.8%) Fits the pattern: «Population on 1 January» 1,964 (no. 284 of 357 from the top; Statistics Norway table 11342); «Gross operating revenue per inhabitant» 179,998 kr (no. 76 of 357 from the top; Statistics Norway table 12137). Most distinctive industry: fiske, fangst og akvakultur, 5% of the jobs, 6.4 times the national share (Statistics Norway table 13470, 2025).
- No. 3 Tydal (10.6%) Fits the pattern: «Gross operating revenue per inhabitant» 294,943 kr (no. 7 of 357 from the top; Statistics Norway table 12137); «Population on 1 January» 773 (no. 346 of 357 from the top; Statistics Norway table 11342); «Detached houses, share of all dwellings» 87.2% (no. 27 of 357 from the top; Statistics Norway table 06265). Most distinctive industry: informasjonstjenester, 8% of the jobs, 41.9 times the national share (Statistics Norway table 13470, 2025).
- No. 357 Gjesdal (2.8%, among the lowest) Fits the pattern: «Centrality (Statistics Norway's centrality index, 6 is most central)» 4 (no. 27 of 357 from the top; Statistics Norway, centrality index); «Gross operating revenue per inhabitant» 115,221 kr (no. 283 of 357 from the top; Statistics Norway table 12137). Most distinctive industry: produksjon av trelast og varer av tre, kork, strå og flettematerialer, unntatt møbler, 5% of the jobs, 13.8 times the national share (Statistics Norway table 13470, 2025).
- No. 356 Ullensaker (3.3%, among the lowest) Fits the pattern: «Centrality (Statistics Norway's centrality index, 6 is most central)» 5 (no. 6 of 357 from the top; Statistics Norway, centrality index); «Detached houses, share of all dwellings» 36.9% (no. 347 of 357 from the top; Statistics Norway table 06265); «Population on 1 January» 45,982 (no. 25 of 357 from the top; Statistics Norway table 11342). Most distinctive industry: lufttransport, 9% of the jobs, 43.6 times the national share (Statistics Norway table 13470, 2025).
- No. 355 Iveland (3.4%, among the lowest) The municipality does not stand out on the figures that otherwise go together with the measure. The explanation probably lies in something we have no figures for. Goes against the pattern: «Gross operating revenue per inhabitant» 174,339 kr (no. 88 of 357 from the top; Statistics Norway table 12137). Most distinctive industry: produksjon av drikkevarer, 13% of the jobs, 116.4 times the national share (Statistics Norway table 13470, 2025).
The analysis describes what goes together, not what causes what. Two figures can follow each other because both depend on something else, such as size, location or industry. The figures are from the latest year available for each source, so the years can differ. Rank correlation runs from −1 to 1; values near 1 mean the municipalities lie in roughly the same order on both measures.
What explains the placing?
- 1. Bø 11.0% Small municipality (2,609 inhabitants): one company or a few people can move the figure a lot. 75% above the median of the municipalities.
- 2. Lødingen 10.8% Small municipality (1,964 inhabitants): one company or a few people can move the figure a lot. 72% above the median of the municipalities.
- 3. Tydal 10.6% Small municipality (773 inhabitants): one company or a few people can move the figure a lot. 69% above the median of the municipalities.
- 355. Iveland 3.4% Small municipality (1,386 inhabitants): one company or a few people can move the figure a lot. 46% below the median of the municipalities.
- 356. Ullensaker 3.3% 47% below the median of the municipalities.
- 357. Gjesdal 2.8% 55% below the median of the municipalities.
| # | Municipality | share aged 80 and over |
|---|---|---|
| 51 | Markersmall municipality | 8.1% |
| 52 | Sel | 8.1% |
| 53 | Auresmall municipality | 8.1% |
| 54 | Høylandetsmall municipality | 8.0% |
| 55 | Stor-Elvdalsmall municipality | 8.0% |
| 56 | Årdal | 8.0% |
| 57 | Andøysmall municipality | 8.0% |
| 58 | Rennebusmall municipality | 8.0% |
| 59 | Solundsmall municipality | 8.0% |
| 60 | Kvitsøysmall municipality | 7.9% |
| 61 | Ullensvang | 7.9% |
| 62 | Åsnes | 7.9% |
| 63 | Lavangensmall municipality | 7.9% |
| 64 | Høyangersmall municipality | 7.9% |
| 65 | Kvam | 7.9% |
| 66 | Åfjordsmall municipality | 7.8% |
| 67 | Tingvollsmall municipality | 7.8% |
| 68 | Strandasmall municipality | 7.8% |
| 69 | Liernesmall municipality | 7.8% |
| 70 | Vågåsmall municipality | 7.7% |
| 71 | Nore og Uvdalsmall municipality | 7.6% |
| 72 | Salangensmall municipality | 7.6% |
| 73 | Ringebusmall municipality | 7.6% |
| 74 | Lesjasmall municipality | 7.6% |
| 75 | Fedjesmall municipality | 7.6% |
| 76 | Trysil | 7.5% |
| 77 | Balsfjord | 7.5% |
| 78 | Kviteseidsmall municipality | 7.5% |
| 79 | Etnedalsmall municipality | 7.5% |
| 80 | Sigdalsmall municipality | 7.5% |
| 81 | Rødøysmall municipality | 7.4% |
| 82 | Austrheimsmall municipality | 7.4% |
| 83 | Våler (Innlandet)small municipality | 7.4% |
| 84 | Heim | 7.4% |
| 85 | Sandesmall municipality | 7.3% |
| 86 | Ossmall municipality | 7.3% |
| 87 | Vegasmall municipality | 7.3% |
| 88 | Værøysmall municipality | 7.3% |
| 89 | Surnadal | 7.3% |
| 90 | Selbusmall municipality | 7.3% |
| 91 | Dønnasmall municipality | 7.3% |
| 92 | Golsmall municipality | 7.2% |
| 93 | Lomsmall municipality | 7.2% |
| 94 | Fjalersmall municipality | 7.2% |
| 95 | Gausdal | 7.2% |
| 96 | Indre Fosen | 7.1% |
| 97 | Tysnessmall municipality | 7.1% |
| 98 | Aremarksmall municipality | 7.1% |
| 99 | Seljordsmall municipality | 7.1% |
| 100 | Røros | 7.0% |