Btec AS
Accounts for 2025 are missing. The deadline was 31 July 2026. The Brønnøysund Register Centre does not publish when accounts arrived, only the latest year filed.
Score · fiscal year 2024
19of 100
How to read this: the company is ahead of 7 % of companies in the Morning class Small in the same sector in 2024. What does this mean?
Rank in the Morning class Small: 501 of 537 · What are Morning company classes?
Place in the whole sector: 2,230 of 2,391 · Industri
Profile
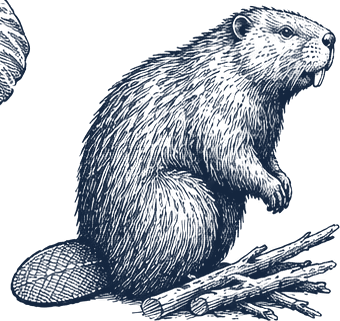
Beaver · Builder
Lower profitability, lower solidity
Position against comparable companies in 2024, not a verdict on the company. Based on profitability 18 and solidity 0 out of 100 among companies in the Morning class Small in the same sector in 2024. Methodology
Against the sector
Btec AS is 32 points below the median for companies in the Morning class Small in the same sector in 2024.
Median score 51 among 537 companies.
Against companies in the Morning class Small in the same sector in 2024: operating margin −3.5% (median 4.6%) and equity ratio −14.0% (median 40.8%).
The numbers behind the score
| Measure | Company | Median |
|---|---|---|
| Operating revenue | 30 MNOK | 21 MNOK |
| Operating margin | −3.5% | 4.6% |
| Profit margin | −6.7% | 4.2% |
| Return on assets | −6.6% | 9.9% |
| Equity ratio | −14.0% | 40.8% |
| Debt-to-equity | – | 1.33 |
| Current ratio | 0.59 | 1.70 |
| Revenue growth | 13.7% | 5.0% |
| Revenue per employee | 1.48 MNOK | 1.50 MNOK |
The median and “ahead of” refer to companies in the Morning class Small in the same sector in 2024. The bar shows the share of companies the figure is ahead of.
With an index of 19, Btec AS does better than 7% of companies in the Morning class Small in the same sector (537 companies) in 2024.
Score 2022–2024
- Btec AS
- Median: companies in the Morning class Small in the same sector
Btec AS has a score of 19 for 2024, rank 2,230 of 2,391 in the sector.
Strongest: Growth: percentile 67 against peers, revenue growth 13.7% against a median of 5.0%.
Weakest: Solidity: percentile 0 against peers, equity ratio −14.0% against a median of 40.8%. Liquidity: percentile 6 against peers, current ratio 0.59 against a median of 1.70.
Worth a closer look
- Equity is negative. How will it be rebuilt, and what do lenders and the auditor say about going concern? Based on: equity ratio −14.0% (median 40.8%).
- Consider strengthening liquidity: current liabilities are 1.7 times current assets. Based on: current ratio 0.59 (median 1.70).
- The company made a loss before tax. Are these one-off items or a pattern? Based on: profit margin −6.7% (median 4.2%).
- What lies behind weak solidity, and will it last?
Written by fixed rules from the figures. Describes the figures, does not explain causes. Not investment or financial advice. How the summary is made
What the numbers say
Btec AS had an operating margin of −3.5% and an equity ratio of −14.0% in 2024, and ranks 2,230 of 2,391 in Industri.
From 2023 to 2024: went from a profit to a loss before tax and the operating margin fell from 4.3% to −3.5%.
Btec AS did better than the sector in 2022, the sector's weakest year.
This text is generated automatically from the 2024 accounts.
Three simple methods
| Method | Multiple | Estimate |
|---|---|---|
| P/E | 10.0 | not meaningful |
| EV/EBIT | 8.0 | not meaningful |
| P/B | 1.0 | not meaningful |
A mechanical estimate from public accounts, not advice. Mechanical estimate from public accounts with fixed multiples. Not a valuation and not advice to buy or sell. The multiples are provisional default values and must be adjusted per sector before the figures are used for anything. See the calculation
Worth a closer look
- critical
Equity is negative. How will it be rebuilt, and what do lenders and the auditor say about going concern?
Based on: Equity ratio −14.0% (median 40.8%).
- watch
Consider strengthening liquidity: current liabilities are 1.7 times current assets.
Based on: Current ratio 0.59 (median 1.70).
- watch
The company made a loss before tax. Are these one-off items or a pattern?
Based on: Profit margin −6.7% (median 4.2%).
- watch
The operating margin is lower than at three in four companies in the sector. Where do costs differ from competitors?
Based on: Operating margin −3.5% (median 4.6%).
Indications based on the latest annual accounts from open data. Not investment or financial advice.
Financial costs were 9.3% of the debt in 2024. The policy rate averaged 4.50 % the same year. This is a plain description of what the debt cost, not a model of interest sensitivity.
See interest rates, prices and exchange rates for the sector
Data quality
- critical Negative equity
Scenario analysis: the sector's weakest year
The operating margin was 19.1% in 2022 (sector median −0.8%), and the equity ratio 4.2%. In the other years the operating margin averaged 0.4%.
The sector's weakest year was 2022, with a median operating margin of −0.8%. Based on the 10 fiscal years we have. The analysis grows as more years are fetched or imported. Methodology
What the score is made of
| Profitability | 18 | weight 30% |
|---|---|---|
| Solidity | 0 | weight 25% |
| Liquidity | 6 | weight 15% |
| Growth | 67 | weight 15% |
| Consistency | 17 | weight 15% |
Durability: 36 (average over 3 years)
Index version 2. Data completeness 100%: the share of the weights that had data.
Questions and answers
How profitable is Btec AS?
The operating margin was −3.5% in 2024, against a median of 4.6% among companies in the Morning class Small in the same sector. Return on assets was −6.6%. The company made a loss before tax.
How solid is Btec AS?
The equity ratio was −14.0% in 2024 (median 40.8%). Equity is negative, so liabilities exceed assets.
What is the liquidity of Btec AS like?
The current ratio was 0.59 in 2024 (median 1.70). Current assets did not cover current liabilities.
How does Btec AS compare in Industri?
Btec AS ranks 2,230 of 2,391 in Industri for 2024. Among companies in the Morning class Small it is number 501 of 537. Revenue changed by 13.7% from the year before.
From the Central Coordinating Register
- Org. no.
- 917551391
- Legal form
- AS
- Sector
- Industri (25.530)
- Morning company class
- Small
- Employees
- 20 registered 10 July 2026
- Founded
- 8 August 2016 10 years in operation
- Share capital
- 0.50 MNOK
- Business address
- Brubakken 37, 5420 RUBBESTADNESET (BØMLO)
- Municipality
- Bømlo rank 2 of 13 in KOSTRA group 8
- Latest accounts filed
- 2024
Source: Central Coordinating Register, Brønnøysund Register Centre. The employee count is reported by the company and may be older than the accounts. See the company at the Brønnøysund Register Centre
Ownership and roles
- Chief executive
- Øystein Onarheim Rolfsnes
- Chair of the board
- Øystein Onarheim Rolfsnes
- Board member
- Terje Rolfsnes
- Auditor
- KPMG AS
Source: Central Coordinating Register, fetched 1 November 2026. Only names are shown.
Owners and shareholdings will appear here once the shareholder data extract is in place.
Coming · not built yet
Error in the data?
Do you see an error in the figures or in how the company is mapped (sector, holding, group)? Let us know. Corrections require documentation.
Figures last fetched 31 October 2026.
Year by year · 2022–2024
| Key figure | 2022 | 2023 | 2024 | Trend |
|---|---|---|---|---|
| Index | 57 | 31 | 19 | |
| Rank | 8 | 1,828 | 2,230 | |
| Operating margin | 19.1% | 4.3% | −3.5% | |
| Return on assets | 33.2% | 7.3% | −6.6% | |
| Equity ratio | 4.2% | −0.5% | −14.0% | |
| Current ratio | 0.86 | 0.81 | 0.59 | |
| Revenue growth | – | 4.4% | 13.7% |
Accounts
From the Brønnøysund Register Centre, in the company's reporting currency (NOK).
| Key figure | 2022 | 2023 | 2024 |
|---|---|---|---|
| Operating revenue | 24.9 MNOK | 26.0 MNOK | 29.5 MNOK |
| Operating profit | 4.8 MNOK | 1.1 MNOK | −1.0 MNOK |
| Profit before tax | 4.1 MNOK | 0.4 MNOK | −2.0 MNOK |
| Net profit | 3.8 MNOK | −0.7 MNOK | −1.6 MNOK |
| Financial expenses | 0.6 MNOK | 0.7 MNOK | 1.2 MNOK |
| Total assets | 14.4 MNOK | 15.1 MNOK | 11.6 MNOK |
| Current assets | 5.8 MNOK | 7.1 MNOK | 4.8 MNOK |
| Equity | 0.6 MNOK | −0.1 MNOK | −1.6 MNOK |
| Retained earnings | 0.1 MNOK | −0.6 MNOK | −2.1 MNOK |
| Total liabilities | 13.7 MNOK | 15.2 MNOK | 13.3 MNOK |
| Current liabilities | 6.7 MNOK | 8.7 MNOK | 8.1 MNOK |
Source: Brønnøysund Register Centre (Register of Company Accounts), fetched 31 October 2026, accounts id 6343471.
Further
Similar companies
- Solwr Robotics AS index 19, rank 2,219 · compare
- Walcon Maritime AS index 19, rank 2,222 · compare
- Hovland Trevarefabrikk AS index 19, rank 2,224 · compare
- Normar Trading AS index 19, rank 2,225 · compare
- Flex Reklame AS index 19, rank 2,226 · compare