Highest and lowest school points
Average lower secondary school points for pupils leaving year 10.
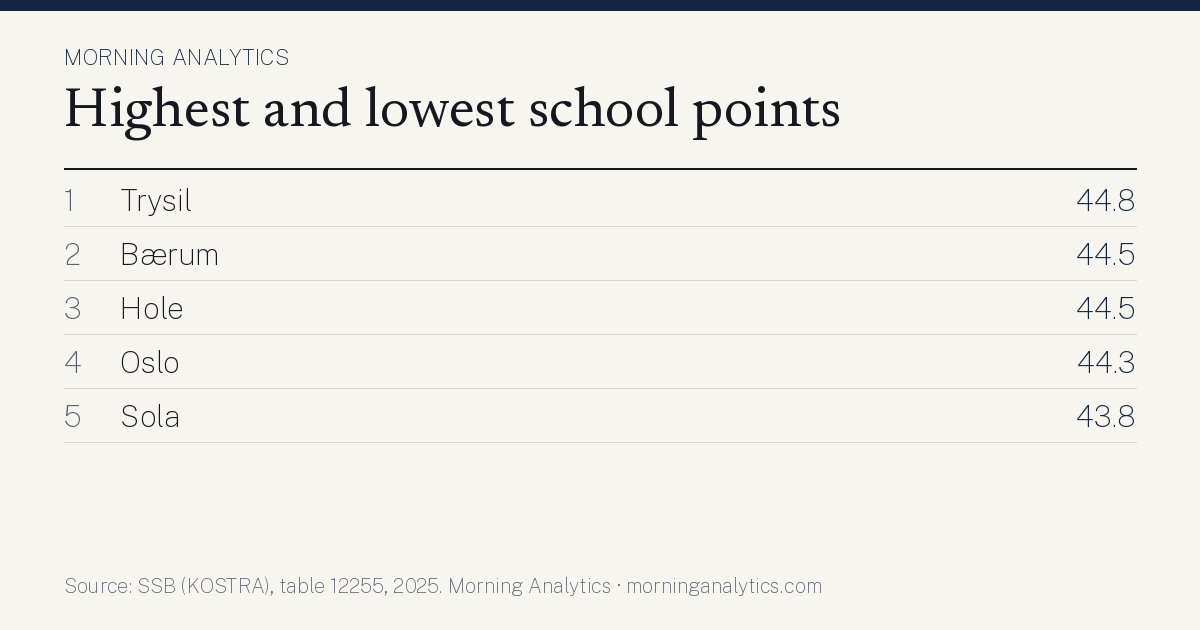
Trysil has the highest school points of Norway's municipalities at 44.8 (2025). The lowest is Årdal at 37.1. Source: SSB (KOSTRA), table 12255, processed by Morning Analytics 2 November 2026.
Download the table (CSV) Sharing image (PNG)
Analysis: why are some at the top and others at the bottom?
We compared school points with every other municipal figure we have, from Statistics Norway, NIPH and the Brønnøysund Register Centre. Below are the figures that go most closely together with school points across the country, and what marks the municipalities at the top and bottom on those figures.
The pattern across the country
- Municipalities that rank high on «Share with university or college education (16 and over)» most often also rank high on school points (moderate association, rank correlation 0.49 across 183 municipalities; Statistics Norway table 09429).
- Municipalities that rank high on «Life expectancy at birth (15-year period)» most often also rank high on school points (moderate association, rank correlation 0.33 across 183 municipalities; NIPH indicator 508).
- Municipalities that rank high on «Gross income per person aged 17 and over, median» most often also rank high on school points (moderate association, rank correlation 0.32 across 183 municipalities; Statistics Norway table 05671).
- Municipalities that rank high on «Centrality (Statistics Norway's centrality index, 6 is most central)» most often also rank high on school points (moderate association, rank correlation 0.31 across 183 municipalities; Statistics Norway, centrality index).
The highest and the lowest
- No. 1 Trysil (44.8) The municipality does not stand out on the figures that otherwise go together with the measure. The explanation probably lies in something we have no figures for. Goes against the pattern: «Gross income per person aged 17 and over, median» 465,000 kr (no. 308 of 357 from the top; Statistics Norway table 05671). Most distinctive industry: sports- og fritidsaktiviteter og drift av fornøyelsesetablissementer, 7% of the jobs, 6.9 times the national share (Statistics Norway table 13470, 2025).
- No. 2 Bærum (44.5) Fits the pattern: «Share with university or college education (16 and over)» 56.4% (no. 1 of 357 from the top; Statistics Norway table 09429); «Gross income per person aged 17 and over, median» 638,400 kr (no. 1 of 357 from the top; Statistics Norway table 05671); «Centrality (Statistics Norway's centrality index, 6 is most central)» 6 (no. 1 of 357 from the top; Statistics Norway, centrality index). Most distinctive industry: arkitektvirksomhet og teknisk konsulentvirksomhet, og teknisk prøving og analyse, 7% of the jobs, 3.4 times the national share (Statistics Norway table 13470, 2025).
- No. 3 Hole (44.5) Fits the pattern: «Share with university or college education (16 and over)» 42.4% (no. 14 of 357 from the top; Statistics Norway table 09429); «Gross income per person aged 17 and over, median» 561,200 kr (no. 16 of 357 from the top; Statistics Norway table 05671); «Centrality (Statistics Norway's centrality index, 6 is most central)» 4 (no. 27 of 357 from the top; Statistics Norway, centrality index). Most distinctive industry: overnattingsvirksomhet, 5% of the jobs, 4.8 times the national share (Statistics Norway table 13470, 2025).
- No. 183 Årdal (37.1, among the lowest) Fits the pattern: «Life expectancy at birth (15-year period)» 81.8 (no. 262 of 348 from the top; NIPH indicator 508). Goes against the pattern: «Gross income per person aged 17 and over, median» 554,300 kr (no. 29 of 357 from the top; Statistics Norway table 05671). Most distinctive industry: produksjon av metaller, 35% of the jobs, 90.8 times the national share (Statistics Norway table 13470, 2025).
- No. 182 Røros (37.8, among the lowest) The municipality does not stand out on the figures that otherwise go together with the measure. The explanation probably lies in something we have no figures for. Goes against the pattern: «Share with university or college education (16 and over)» 32.3% (no. 76 of 357 from the top; Statistics Norway table 09429). Most distinctive industry: produksjon av møbler, 5% of the jobs, 35.2 times the national share (Statistics Norway table 13470, 2025).
- No. 181 Vestnes (37.8, among the lowest) Fits the pattern: «Share with university or college education (16 and over)» 24.1% (no. 285 of 357 from the top; Statistics Norway table 09429); «Life expectancy at birth (15-year period)» 81.7 (no. 266 of 348 from the top; NIPH indicator 508). Most distinctive industry: produksjon av andre transportmidler, 11% of the jobs, 20.3 times the national share (Statistics Norway table 13470, 2025).
The analysis describes what goes together, not what causes what. Two figures can follow each other because both depend on something else, such as size, location or industry. The figures are from the latest year available for each source, so the years can differ. Rank correlation runs from −1 to 1; values near 1 mean the municipalities lie in roughly the same order on both measures.
What explains the placing?
- 1. Trysil 44.8 8% above the median of the municipalities.
- 2. Bærum 44.5 7% above the median of the municipalities.
- 3. Hole 44.5 7% above the median of the municipalities.
- 181. Vestnes 37.8 9% below the median of the municipalities.
- 182. Røros 37.8 9% below the median of the municipalities.
- 183. Årdal 37.1 11% below the median of the municipalities.
| # | Municipality | school points |
|---|---|---|
| 51 | Øvre Eiker | 42.2 |
| 52 | Gran | 42.2 |
| 53 | Tromsø | 42.2 |
| 54 | Fauske | 42.1 |
| 55 | Vågan | 42.1 |
| 56 | Nesodden | 42.1 |
| 57 | Horten | 42.1 |
| 58 | Kvam | 42.1 |
| 59 | Kristiansund | 42.0 |
| 60 | Ørsta | 42.0 |
| 61 | Øyer | 42.0 |
| 62 | Sveio | 42.0 |
| 63 | Luster | 42.0 |
| 64 | Hå | 41.9 |
| 65 | Meløy | 41.9 |
| 66 | Drammen | 41.9 |
| 67 | Risør | 41.9 |
| 68 | Birkenes | 41.9 |
| 69 | Lyngdal | 41.9 |
| 70 | Kvinesdal | 41.9 |
| 71 | Midtre Gauldal | 41.9 |
| 72 | Malvik | 41.9 |
| 73 | Time | 41.8 |
| 74 | Alstahaug | 41.8 |
| 75 | Færder | 41.8 |
| 76 | Arendal | 41.8 |
| 77 | Øygarden | 41.8 |
| 78 | Sogndal | 41.8 |
| 79 | Skaun | 41.8 |
| 80 | Ulstein | 41.7 |
| 81 | Lillestrøm | 41.7 |
| 82 | Vestby | 41.7 |
| 83 | Narvik | 41.6 |
| 84 | Hadsel | 41.6 |
| 85 | Jevnaker | 41.6 |
| 86 | Gjøvik | 41.6 |
| 87 | Kvinnherad | 41.6 |
| 88 | Stjørdal | 41.6 |
| 89 | Klepp | 41.5 |
| 90 | Volda | 41.5 |
| 91 | Larvik | 41.5 |
| 92 | Skien | 41.5 |
| 93 | Vennesla | 41.5 |
| 94 | Hitra | 41.5 |
| 95 | Sykkylven | 41.4 |
| 96 | Tvedestrand | 41.4 |
| 97 | Eigersund | 41.3 |
| 98 | Surnadal | 41.3 |
| 99 | Indre Østfold | 41.3 |
| 100 | Ål | 41.3 |
Not ranked because the municipality has fewer than 5,000 inhabitants, where a few people can move the figure a lot (150): Alvdal (41.5), Andøy (42.2), Aremark (47.1), Askvoll (40.0), Aukra (43.2), Aure (42.6), Aurland (46.2), Austrheim (39.7), Bardu (42.4), Bindal (46.7), Bjerkreim (44.3), Bokn (46.0), Bremanger (41.4), Bygland (46.2), Bykle (48.1), Båtsfjord (41.6), Bø (37.1), Dovre (43.0), Drangedal (39.7), Dyrøy (38.5), Dønna (43.7), Eidfjord (46.8), Etne (42.2), Etnedal (44.4), Evenes (41.9), Evje og Hornnes (41.6), Fitjar (44.1), Fjaler (43.8), Fjord (43.7), Flatanger (45.4), Flesberg (43.2), Flå (42.5), Folldal (43.7), Frosta (37.9), Fyresdal (39.6), Gamvik (39.6), Gildeskål (40.4), Gjemnes (44.0), Gjerstad (41.8), Gol (42.4) …
Not available for 24 municipalities (hidden by the source, too small or not measured): Beiarn, Berlevåg, Engerdal, Fedje, Flakstad, Gratangen, Hasvik, Lavangen, Leka, Loppa, Modalen, Moskenes …