Highest and lowest life expectancy
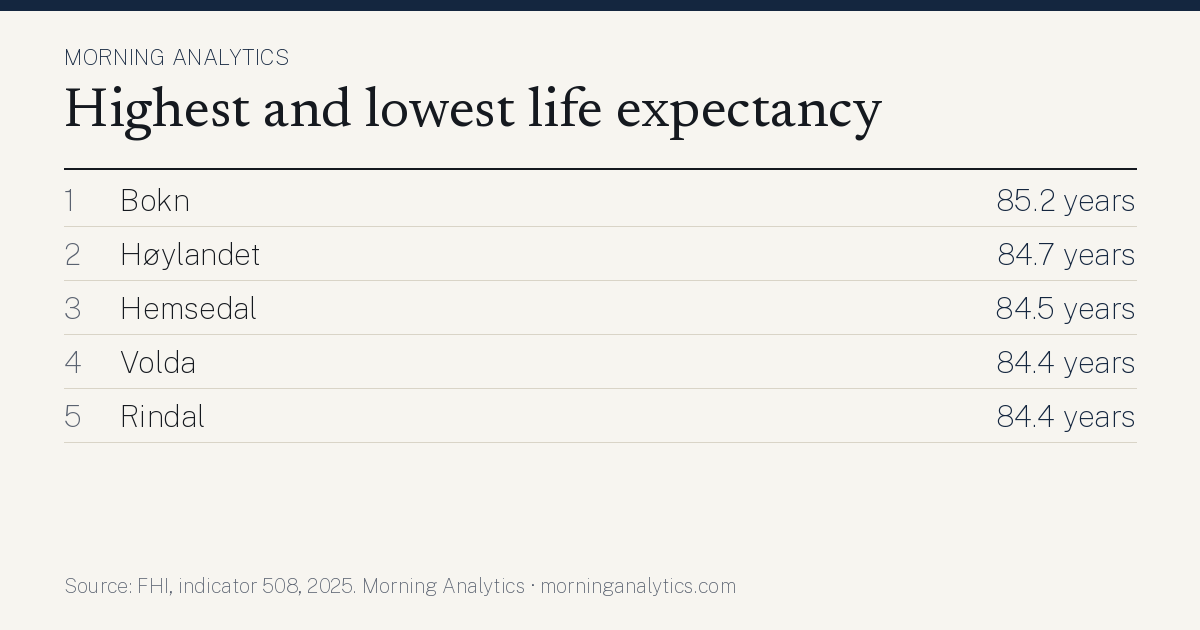
How long a newborn can expect to live, computed over 15 years to even out chance swings in small municipalities.
Bokn has the highest life expectancy of Norway's municipalities at 85.2 years (2025). The lowest is Vardø at 78.2 years. Source: FHI, indicator 508, processed by Morning Analytics 4 November 2026.
Download the table (CSV) Sharing image (PNG)
The picture in figures
The bars show the ten highest and the ten lowest of 348 municipalities. The dashed line is the median of all municipalities.
Each bar is the number of municipalities in a range of values. The dashed line is the median. Hover over a bar to see the range.
Analysis: why are some at the top and others at the bottom?
We compared life expectancy with every other municipal figure we have, from Statistics Norway, NIPH and the Brønnøysund Register Centre. Below are the figures that go most closely together with life expectancy across the country, and what marks the municipalities at the top and bottom on those figures.
The pattern across the country
- Municipalities that rank high on «Household income after tax, median» most often also rank high on life expectancy (strong association, rank correlation 0.56 across 348 municipalities; Statistics Norway table 06944).
- Municipalities that rank high on «Share with lower secondary as highest education (16 and over)» most often rank low on life expectancy (strong association, rank correlation −0.55 across 348 municipalities; Statistics Norway table 09429).
- Municipalities that rank high on «Employed, share of age 20–66» most often also rank high on life expectancy (strong association, rank correlation 0.53 across 348 municipalities; Statistics Norway table 11618).
- Municipalities that rank high on «Disability benefit recipients aged 20–66 (standardised)» most often rank low on life expectancy (moderate association, rank correlation −0.49 across 348 municipalities; NIPH indicator 787).
The highest and the lowest
- No. 1 Bokn (85.2 years) Fits the pattern: «Household income after tax, median» 763,000 kr (no. 24 of 357 from the top; Statistics Norway table 06944); «Employed, share of age 20–66» 80.1% (no. 52 of 357 from the top; Statistics Norway table 11618); «Share with lower secondary as highest education (16 and over)» 21.1% (no. 301 of 357 from the top; Statistics Norway table 09429). Most distinctive industry: fiske, fangst og akvakultur, 18% of the jobs, 22.6 times the national share (Statistics Norway table 13470, 2025).
- No. 2 Høylandet (84.7 years) Fits the pattern: «Employed, share of age 20–66» 83.0% (no. 6 of 357 from the top; Statistics Norway table 11618); «Share with lower secondary as highest education (16 and over)» 21.0% (no. 305 of 357 from the top; Statistics Norway table 09429). Most distinctive industry: jordbruk og tjenester tilknyttet jordbruk, jakt og viltstell, 11% of the jobs, 8.4 times the national share (Statistics Norway table 13470, 2025).
- No. 3 Hemsedal (84.5 years) Fits the pattern: «Disability benefit recipients aged 20–66 (standardised)» 6.3% (no. 354 of 357 from the top; NIPH indicator 787); «Share with lower secondary as highest education (16 and over)» 19.0% (no. 347 of 357 from the top; Statistics Norway table 09429); «Employed, share of age 20–66» 80.0% (no. 55 of 357 from the top; Statistics Norway table 11618). Most distinctive industry: overnattingsvirksomhet, 10% of the jobs, 9.2 times the national share (Statistics Norway table 13470, 2025).
- No. 348 Vardø (78.2 years, among the lowest) Fits the pattern: «Household income after tax, median» 527,000 kr (no. 353 of 357 from the top; Statistics Norway table 06944); «Share with lower secondary as highest education (16 and over)» 30.5% (no. 49 of 357 from the top; Statistics Norway table 09429); «Employed, share of age 20–66» 73.3% (no. 284 of 357 from the top; Statistics Norway table 11618). Most distinctive industry: fiske, fangst og akvakultur, 14% of the jobs, 17.8 times the national share (Statistics Norway table 13470, 2025).
- No. 347 Gamvik (78.6 years, among the lowest) Fits the pattern: «Household income after tax, median» 503,600 kr (no. 357 of 357 from the top; Statistics Norway table 06944); «Share with lower secondary as highest education (16 and over)» 39.5% (no. 3 of 357 from the top; Statistics Norway table 09429); «Employed, share of age 20–66» 68.7% (no. 347 of 357 from the top; Statistics Norway table 11618). Most distinctive industry: fiske, fangst og akvakultur, 30% of the jobs, 37.6 times the national share (Statistics Norway table 13470, 2025).
- No. 346 Loppa (79.0 years, among the lowest) Fits the pattern: «Share with lower secondary as highest education (16 and over)» 39.0% (no. 4 of 357 from the top; Statistics Norway table 09429); «Household income after tax, median» 544,000 kr (no. 351 of 357 from the top; Statistics Norway table 06944); «Employed, share of age 20–66» 72.2% (no. 305 of 357 from the top; Statistics Norway table 11618). Most distinctive industry: fiske, fangst og akvakultur, 21% of the jobs, 26.0 times the national share (Statistics Norway table 13470, 2025).
The analysis describes what goes together, not what causes what. Two figures can follow each other because both depend on something else, such as size, location or industry. The figures are from the latest year available for each source, so the years can differ. Rank correlation runs from −1 to 1; values near 1 mean the municipalities lie in roughly the same order on both measures.
What explains the placing?
- 1. Bokn 85.2 years Small municipality (907 inhabitants): one company or a few people can move the figure a lot. 3% above the median of the municipalities.
- 2. Høylandet 84.7 years Small municipality (1,230 inhabitants): one company or a few people can move the figure a lot. 3% above the median of the municipalities.
- 3. Hemsedal 84.5 years Small municipality (2,707 inhabitants): one company or a few people can move the figure a lot. 3% above the median of the municipalities.
- 346. Loppa 79.0 years Small municipality (846 inhabitants): one company or a few people can move the figure a lot. 4% below the median of the municipalities.
- 347. Gamvik 78.6 years Small municipality (1,019 inhabitants): one company or a few people can move the figure a lot. 5% below the median of the municipalities.
- 348. Vardø 78.2 years Small municipality (1,969 inhabitants): one company or a few people can move the figure a lot. 5% below the median of the municipalities.
| # | Municipality | life expectancy |
|---|---|---|
| 201 | Vennesla | 82.2 years |
| 202 | Rana | 82.2 years |
| 203 | Narvik | 82.2 years |
| 204 | Eidfjordsmall municipality | 82.2 years |
| 205 | Suldalsmall municipality | 82.2 years |
| 206 | Ossmall municipality | 82.2 years |
| 207 | Lurøysmall municipality | 82.2 years |
| 208 | Nesnasmall municipality | 82.1 years |
| 209 | Vågan | 82.1 years |
| 210 | Horten | 82.1 years |
| 211 | Østre Toten | 82.1 years |
| 212 | Midt-Telemark | 82.1 years |
| 213 | Modum | 82.1 years |
| 214 | Nærøysund | 82.1 years |
| 215 | Arendal | 82.1 years |
| 216 | Elverum | 82.1 years |
| 217 | Skiptvetsmall municipality | 82.1 years |
| 218 | Skien | 82.1 years |
| 219 | Ringsaker | 82.1 years |
| 220 | Målselv | 82.1 years |
| 221 | Lavangensmall municipality | 82.1 years |
| 222 | Haugesund | 82.1 years |
| 223 | Gjøvik | 82.1 years |
| 224 | Verdal | 82.1 years |
| 225 | Fredrikstad | 82.0 years |
| 226 | Vefsn | 82.0 years |
| 227 | Hurdalsmall municipality | 82.0 years |
| 228 | Rakkestad | 82.0 years |
| 229 | Aurskog-Høland | 82.0 years |
| 230 | Frøya | 82.0 years |
| 231 | Nord-Fron | 82.0 years |
| 232 | Åseralsmall municipality | 82.0 years |
| 233 | Nes | 82.0 years |
| 234 | Vestre Toten | 82.0 years |
| 235 | Rødøysmall municipality | 82.0 years |
| 236 | Sør-Varanger | 82.0 years |
| 237 | Ringerike | 82.0 years |
| 238 | Moss | 82.0 years |
| 239 | Hadsel | 81.9 years |
| 240 | Trysil | 81.9 years |
| 241 | Hitra | 81.9 years |
| 242 | Bamble | 81.9 years |
| 243 | Alvdalsmall municipality | 81.9 years |
| 244 | Alstahaug | 81.9 years |
| 245 | Kristiansund | 81.9 years |
| 246 | Tolgasmall municipality | 81.9 years |
| 247 | Folldalsmall municipality | 81.9 years |
| 248 | Indre Østfold | 81.9 years |
| 249 | Notodden | 81.9 years |
| 250 | Sør-Fronsmall municipality | 81.9 years |
Not available for 9 municipalities (hidden by the source, too small or not measured): Fedje, Kvitsøy, Leka, Modalen, Røst, Røyrvik, Træna, Utsira, Vevelstad