Trondheim in figures
A card for sharing, for example on LinkedIn. The same figures as the municipality page, with source and year.
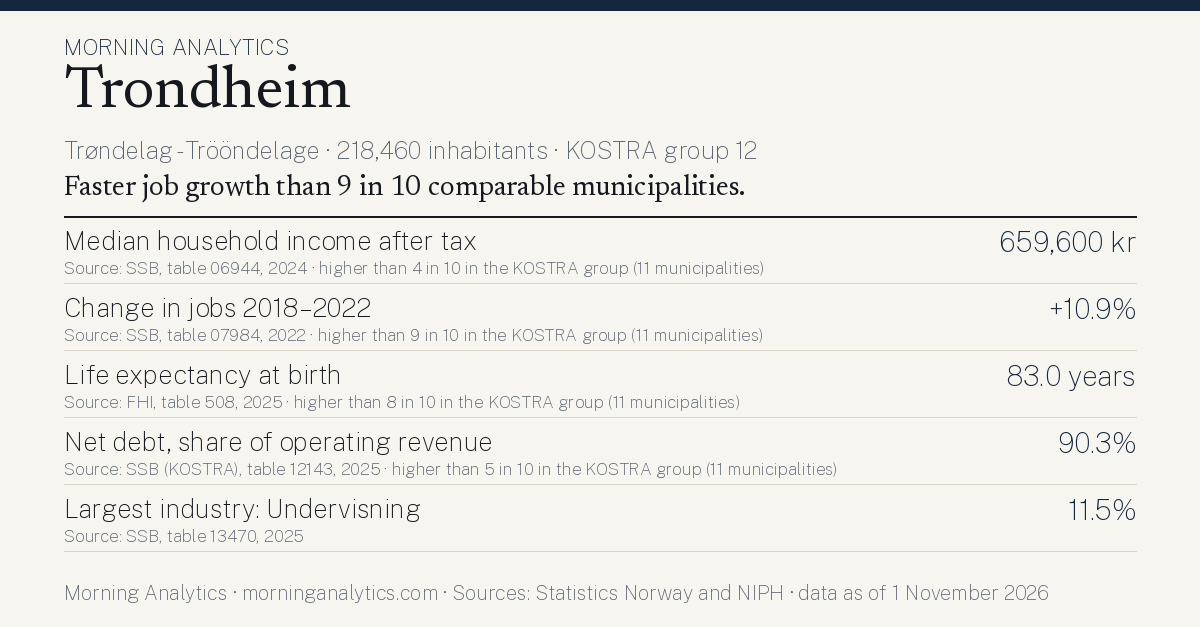
The figures on the card
Faster job growth than 9 in 10 comparable municipalities.
- Median household income after tax
- 659,600 kr Source: SSB, table 06944, 2024 · higher than 4 in 10 in the KOSTRA group (11 municipalities)
- Change in jobs 2018–2022
- +10.9% Source: SSB, table 07984, 2022 · higher than 9 in 10 in the KOSTRA group (11 municipalities)
- Life expectancy at birth
- 83.0 years Source: FHI, table 508, 2025 · higher than 8 in 10 in the KOSTRA group (11 municipalities)
- Net debt, share of operating revenue
- 90.3% Source: SSB (KOSTRA), table 12143, 2025 · higher than 5 in 10 in the KOSTRA group (11 municipalities)
- Largest industry: Undervisning
- 11.5% Source: SSB, table 13470, 2025
“Comparable municipalities” is the municipality's KOSTRA group at Statistics Norway. The sentence is chosen by fixed rules: the figure where the municipality is furthest from the middle of its group. No judgement of what is good or bad.