Compare companies
Selected: 2 of 5
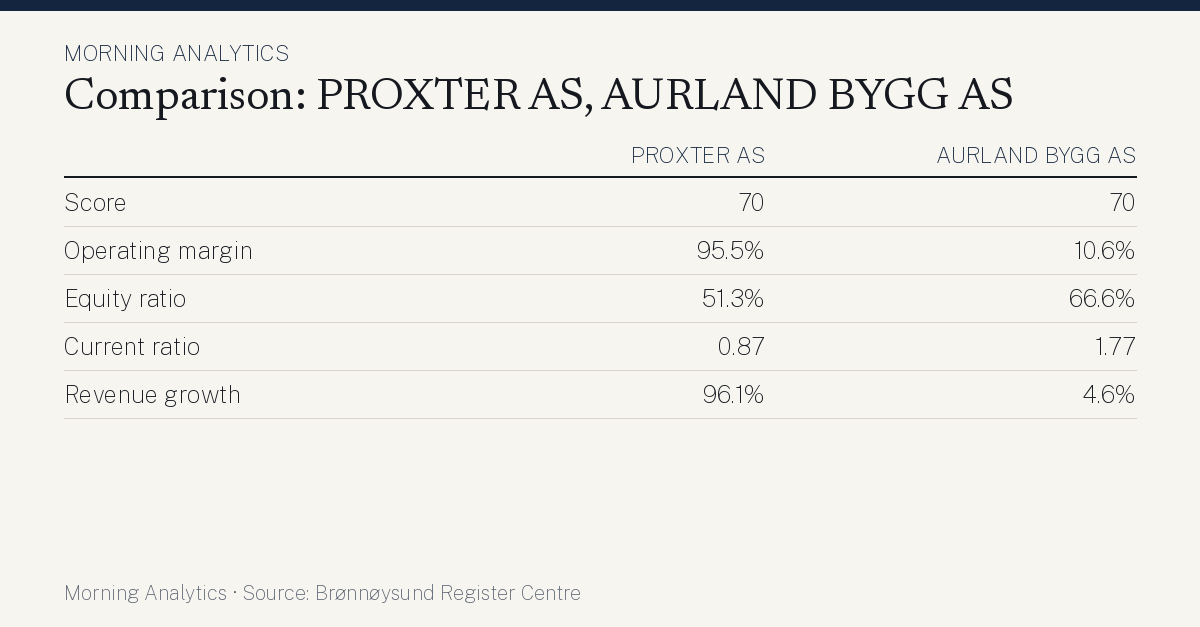
Key figures side by side
| Measure | Proxter AS2025 | Aurland Bygg AS2025 |
|---|---|---|
| Sector and size | Bygg og anlegg · Micro | Bygg og anlegg · Micro |
| Score | 70 rank 2,860 of 20,336 | 70 rank 2,859 of 20,336 |
| Operating revenue | 6 MNOKmedian 3 MNOK | 2 MNOKmedian 3 MNOK |
| Operating margin | 95.5%median 3.5% | 10.6%median 3.5% |
| Profit margin | 95.4%median 3.0% | 10.7%median 3.0% |
| Return on assets | 32.1%median 7.8% | 36.5%median 7.8% |
| Equity ratio | 51.3%median 32.8% | 66.6%median 32.8% |
| Debt-to-equity | 0.95median 1.43 | 0.50median 1.43 |
| Current ratio | 0.87median 1.41 | 1.77median 1.41 |
| Revenue growth | 96.1%median 6.1% | 4.6%median 6.1% |
| Employees (Enhetsregisteret) | not available | not available |
The median is each company's own comparison group: same sector, financial year and size group. Source: Brønnøysund Register Centre.
Indications based on the latest annual accounts from open data. Not investment or financial advice.